 |
The H1 Experiment has reported new beauty and charm
measurements [45,43,46]
in which the impact parameters of selected tracks coming
from secondary decay vertices are used to identify
beauty and charm events (see section 5.5.2).
The track selection requires full silicon vertex
detector information and imposes a transverse momentum cut ![]() MeV.
MeV.
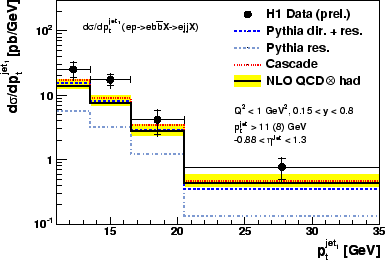
The dijet beauty photoproduction cross
section is measured for events with two jets with
![]() GeV [45] in the central region
of pseudo-rapidity.
In fig.34 the differential cross section is presented
as a function of the jet transverse momentum
GeV [45] in the central region
of pseudo-rapidity.
In fig.34 the differential cross section is presented
as a function of the jet transverse momentum ![]() .
The data are found to be higher than predictions from the NLO
QCD calculation in the massive scheme FMNR [80]
and from the Monte Carlo programs PYTHIA [108] and
CASCADE [104] by about a factor of 1.8.
The result for the charm dijet cross section as obtained in the
same analysis shows good agreement of the theory with the data.
.
The data are found to be higher than predictions from the NLO
QCD calculation in the massive scheme FMNR [80]
and from the Monte Carlo programs PYTHIA [108] and
CASCADE [104] by about a factor of 1.8.
The result for the charm dijet cross section as obtained in the
same analysis shows good agreement of the theory with the data.
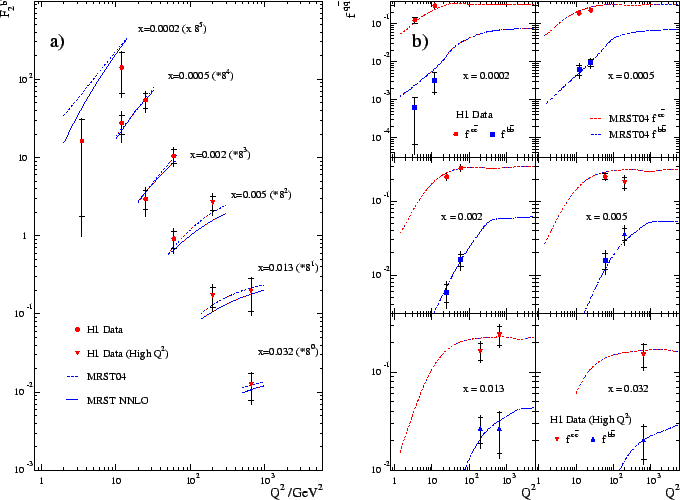 |
The beauty and charm structure functions have been determined
by the H1 collaboration in the range
![]() GeV
and
GeV
and
![]() (see fig.35).
In this kinematic range, more than 80% of the charm events
and more than 96% of the beauty events have a track within the
detector acceptance. The extrapolation from
the measured sample to the full phase space is therefore small,
leading to small uncertainties due to model assumptions.
This is the first measurement of
(see fig.35).
In this kinematic range, more than 80% of the charm events
and more than 96% of the beauty events have a track within the
detector acceptance. The extrapolation from
the measured sample to the full phase space is therefore small,
leading to small uncertainties due to model assumptions.
This is the first measurement of
![]() .
.
The measurements of
![]() are
shown in fig.35.
The results for
are
shown in fig.35.
The results for
![]() from this and other analyses
are shown in fig.24.
Scaling violations are visible which increase towards lower
values of
from this and other analyses
are shown in fig.24.
Scaling violations are visible which increase towards lower
values of ![]() , indicating that towards low
, indicating that towards low ![]() charm and beauty production is
dominated by the boson-gluon fusion process.
The beauty data are compared with a NLO QCD predictions from
NLO QCD [164] and with a recent prediction in NNLO [60].
Both calculations are performed in the variable flavour number scheme.
The predictions of the QCD calculations are compatible
with the data.
charm and beauty production is
dominated by the boson-gluon fusion process.
The beauty data are compared with a NLO QCD predictions from
NLO QCD [164] and with a recent prediction in NNLO [60].
Both calculations are performed in the variable flavour number scheme.
The predictions of the QCD calculations are compatible
with the data.
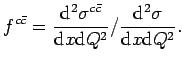
In fig.35b the measurements
are presented in the form of the fractional contribution
to the total ![]() cross section
cross section
 |
(9) |