 |
Many models have been suggested to describe inelastic charmonium
production in the framework of perturbative QCD, such as the
color-singlet model (CSM) [167,169,168,170],
the color-evaporation model [171,172] and soft
color interactions [173]. Most recently the ansatz
of non-relativistic quantum chromodynamics (NRQCD) factorization
was introduced in which colour octet ![]() states
contribute to the charmonium production cross section.
states
contribute to the charmonium production cross section.
Theoretical calculations based on the NRQCD factorization approach [174,175,176] are available in leading order [177,178,179,180,181,182]. In the NRQCD factorization approach the size of the color octet contributions, which are described by long distance matrix elements (LDME), are additional free parameters and have been determined in fits to the Tevatron data [183]. The NRQCD factorization approach contains the color singlet model which is recovered in the limit in which the long distance matrix elements tend to zero.
For ![]() and
and ![]() photoproduction, the CSM calculations are
available including next-to-leading order contributions [184,185].
Alternatively, using the CSM, inelastic
photoproduction, the CSM calculations are
available including next-to-leading order contributions [184,185].
Alternatively, using the CSM, inelastic ![]() production can be modeled in the
production can be modeled in the
![]() factorization approach (see section 2.5) using
an unintegrated (
factorization approach (see section 2.5) using
an unintegrated (![]() dependent) gluon density in the
proton [187,186,190].
dependent) gluon density in the
proton [187,186,190].
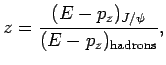
Figure 41 shows data from CDF [191,192]
together with CSM calculations to leading order and fitted
color octet contributions. It can be seen that the color octet contributions are large,
leading to a good description of the data.
Unfortunately those long distance matrix elements which are most
important in ![]() and
and ![]() photoproduction at HERA, are not
well constrained by the Tevatron data and thus contain
large uncertainties [165].
The new charmonium results from the Tevatron Run-II (see
e.g.fig.7)
which provide much more statistics and extend to lower values of
photoproduction at HERA, are not
well constrained by the Tevatron data and thus contain
large uncertainties [165].
The new charmonium results from the Tevatron Run-II (see
e.g.fig.7)
which provide much more statistics and extend to lower values of
![]() could help to reduce the uncertainties of the LDME significantly.
could help to reduce the uncertainties of the LDME significantly.
It should be noted that next-to-leading-order corrections might change the
size of the color octet contributions substantially. Although
the NLO terms have not been calculated in the NRQCD approach, effects that
are similar
to those in the CSM may be expected, in which the NLO terms lead to an
increase in the cross
section of typically a factor two, with a strong
![]() dependence.
dependence.
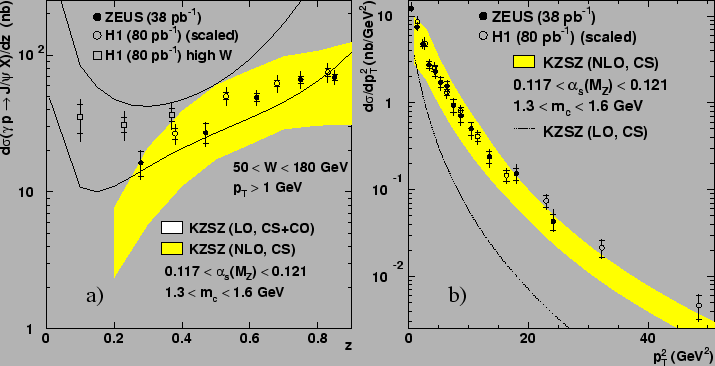 |
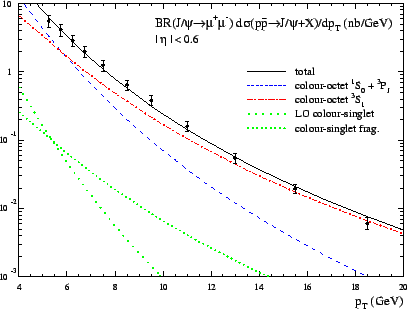
Figure 42 shows the measurements of the
![]() cross section by the H1 collaboration [29]
and the ZEUS collaboration [32], compared with the
theoretical predictions given in Ref. [165].
The variable
cross section by the H1 collaboration [29]
and the ZEUS collaboration [32], compared with the
theoretical predictions given in Ref. [165].
The variable ![]() denotes the fraction of the photon energy in the proton rest frame
that is transferred to the
denotes the fraction of the photon energy in the proton rest frame
that is transferred to the ![]() and is defined as
and is defined as
The ![]() data are not corrected for feeddown processes from
diffractive and inelastic production of
data are not corrected for feeddown processes from
diffractive and inelastic production of ![]() mesons (
mesons (
![]() ),
the production of
),
the production of ![]() hadrons with subsequent decays to
hadrons with subsequent decays to ![]() mesons,
or feeddown from the production of
mesons,
or feeddown from the production of ![]() states.
The latter two contributions are estimated to contribute between
5% at medium
states.
The latter two contributions are estimated to contribute between
5% at medium ![]() and 30% at the lowest values of
and 30% at the lowest values of ![]() .
.
The open band in fig.42 represents the sum of the
color-singlet and color-octet contributions, calculated in leading
order NRQCD. The uncertainty is due to the
uncertainty in the color-octet NRQCD matrix elements. The shaded band shows the
calculation of the color-singlet contribution to next-to-leading order
in ![]() [184,185] which describes
the data quite well without the inclusion of a
color-octet contribution.
The next-to-leading-order QCD corrections are crucial in describing the
shape of the transverse-momentum distribution of the
[184,185] which describes
the data quite well without the inclusion of a
color-octet contribution.
The next-to-leading-order QCD corrections are crucial in describing the
shape of the transverse-momentum distribution of the ![]() .
.
 |
The ![]() factorization approach [187,188,189,190]
has been applied for
factorization approach [187,188,189,190]
has been applied for ![]() production [186].
Figure 43 shows a comparison of the data with the
predictions from the
production [186].
Figure 43 shows a comparison of the data with the
predictions from the ![]() factorization approach as implemented in the Monte Carlo
generator CASCADE. Good agreement is
observed between data and predictions for
factorization approach as implemented in the Monte Carlo
generator CASCADE. Good agreement is
observed between data and predictions for
![]() . At high
. At high ![]() values, the CASCADE calculation underestimates the cross section.
The CASCADE predictions for the the
values, the CASCADE calculation underestimates the cross section.
The CASCADE predictions for the the
![]() dependence of
the cross section (fig.43c) fit the data considerably
better than the collinear LO calculations (dotted curve in fig.42b).
This improved fit is attributed to
the transverse momentum of the gluons from the proton, which contribute
to the transverse momentum of the
dependence of
the cross section (fig.43c) fit the data considerably
better than the collinear LO calculations (dotted curve in fig.42b).
This improved fit is attributed to
the transverse momentum of the gluons from the proton, which contribute
to the transverse momentum of the ![]() meson.
meson.
The polarization of the ![]() meson is expected to differ in the
various theoretical approaches discussed here and could in principle
be used to distinguish between them, independently of normalization
uncertainties. The general decay angular distribution can be
parameterized as
meson is expected to differ in the
various theoretical approaches discussed here and could in principle
be used to distinguish between them, independently of normalization
uncertainties. The general decay angular distribution can be
parameterized as
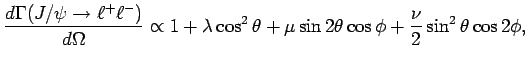 |
(11) |
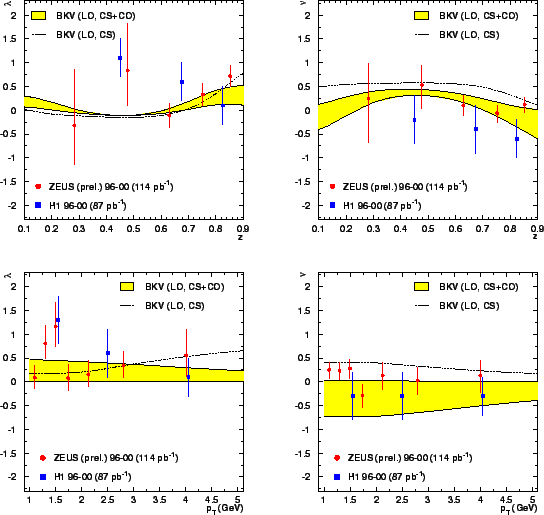 |
In fig.44, the data are shown, together with the results
from two LO calculations: the NRQCD prediction, including color-octet
and color-singlet contributions [178], and the color-singlet
contribution alone.
In contrast to the predictions shown in fig.44,
in which ![]() is zero or positive, the prediction of
the
is zero or positive, the prediction of
the ![]() factorization approach is that
factorization approach is that ![]() should become
increasingly negative toward larger values of
should become
increasingly negative toward larger values of
![]() ,
reaching
,
reaching
![]() at
at
![]() GeV.
However, at present, the errors in the
data preclude any firm conclusions.
In order to distinguish between
full NRQCD and the color-singlet contribution alone, measurements at
larger
GeV.
However, at present, the errors in the
data preclude any firm conclusions.
In order to distinguish between
full NRQCD and the color-singlet contribution alone, measurements at
larger
![]() are required. The measured values of
are required. The measured values of
![]() , for which no prediction is available from the
, for which no prediction is available from the ![]() factorization
approach, slightly favor the full NRQCD prediction.
factorization
approach, slightly favor the full NRQCD prediction.
In conclusion, it should be noted that calculations to next-to-leading order, which are not yet available in the framework of NRQCD factorization, could be an essential ingredient in a full quantitative understanding of charmonium production at HERA, and also at other experiments, such as those at the Tevatron.