Next: Deterministic Annealing
Up: Lifetime Tag
Previous: Negative Subtraction Method
Contents
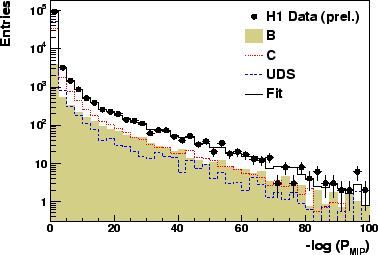
Figure:
Distribution of the negative logarithm of the multi impact
parameter
probability. The decomposition of the simulation into  (shaded
histogram),
(shaded
histogram),  (dotted line),
  (dashed line) is taken
from the fit [45] (see text).
(dashed line) is taken
from the fit [45] (see text).
 |
In this method, the impact parameters of all well measured, i.e.selected,
tracks in a given jet are used to form a probability that the tracks
come from the primary interaction point and not from the
decay of a long lived particle.
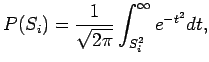
The quantity
can be interpreted as the probability that a track originates from the primary vertex.
The probabilities for tracks with negative significances are set to unity.
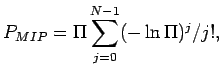
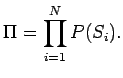
A multi impact parameter (MIP) probability  is then constructed by combining the
probabilities of the
is then constructed by combining the
probabilities of the  selected tracks within each jet:
where
selected tracks within each jet:
where  runs over all selected tracks and
The distribution of the negative logarithm
runs over all selected tracks and
The distribution of the negative logarithm
 for both jets is shown in fig.18.
The contributions from events containing , and
quarks are determined by a fit [150,151]
to the
distribution,
using the Monte Carlo expectations
for the shapes of each of these quark flavours.
for both jets is shown in fig.18.
The contributions from events containing , and
quarks are determined by a fit [150,151]
to the
distribution,
using the Monte Carlo expectations
for the shapes of each of these quark flavours.
Next: Deterministic Annealing
Up: Lifetime Tag
Previous: Negative Subtraction Method
Contents
Andreas Meyer
2006-02-13